Can you see where your drivers go!?
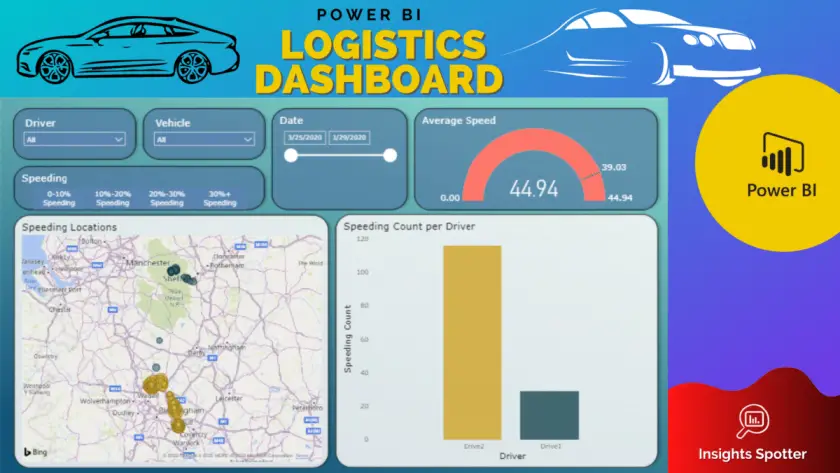
Example of Power BI Dashboard To Track Driver and Vehicles
Do you have the company’s drivers’ data? Would you like to improve the efficiency of your drivers’ routes? Or maybe investigate synergies?
You have come to the right place. Below is an example of the dashboard I have done for one company for just that reason. Please, play around below and have a feel for it.
Simple Power BI Logistics Dashboard Sample for Free
Power BI Logistics dashboard solution uses Power BI to clean and transform data as an ETL layer. Then, insightful analytics tools, available in Power BI, allowing you to slice and dice data to get the right insights for your business. Plus, it is all automated so anytime you have new files you can drop them in dedicated location and dashboard automatically is updated.
Btw, you can get Microsoft Power BI for free with companies business email. It allows one user to test most of the capabilities of Power BI. This is enough to use the full-functioning Power BI dashboard on your computer or online and immediately get insights. Also, Power BI is fully integrated with other Microsoft Office programs. If you like to get a bespoke dashboard for your needs then go to my services page and have a look at available options. Do not find an option for you?! Just drop me a line, we will create one!
Links:
Subscribe to our newsletter!
Latest Blog Posts
- Sustainable Project Management: Trends, Tools, & Strategies
- Unlocking Strategic Value: How NIST CSF 2.0 Shapes Project Choices for Better Outcomes
- Cybersecurity Project Management: Protecting Your Digital Frontier
- What are the Different Types of Planning in Project Management?

- Transforming Project Management with AI Software: Tools, Challenges, and Best Practices
- Unlocking the Benefits of AI-Powered Project Management

