COVID-19 In Numbers
The Power In Knowledge And Numbers
COVID-19:
I think these days everyone has heard about COVID-19 also known as Coronavirus. We all have been affected in one way or another. And I am not an exception. Those that are least affected had to work from home, others have more serious issues like losing jobs or having family concerns. Eventually, these issues are affecting individuals psychologically. On top of that, the unknown of the situation adds to ever-mounting pressure. With this article, I will try to provide more clarity using numbers with full dashboard available at the end. Hopefully, this will help to alleviate some of the psychological strains caused by COVID-19.
What is COVID-19:
A novel coronavirus (in medical terms called SARS-CoV-2) was detected in three patients with pneumonia in December 2019. These patients were connected with a cluster of respiratory diseases from Wuhan, China. Various media sources would suggest that doctors knew the virus could cause significant issues quite soon after identified as a new strain. China was suppressing information, but soon the infected numbers were too great to try to hide.
This is when you, me and the world starts questioning what if?! Well as we know now, “if” became the reality and as of 1st of April 2020 virus is spreading fast. Countries are building makeshift hospitals to address the ever-increasing threat and they desperately need additional hospital beds as well as mechanical ventilators. I think everyone would agree that we have not seen sort of situation for at least 100 years. Probably only Spanish flu could compete.
Dealing With COVID-19:
Government has published guidelines on how to protect yourself from the virus. Also, what to do when you get one. The part of the blog post is not about that but I will leave a link to NHS guidelines in the link below. As we all should still wash our hands and try not to get too close to people outside. Nonetheless, in this section, I would like to address something that was initially overlooked but becomes more and more apparent as we go deeper into the crises.
In the section, I would like to reflect on how I am dealing with COVID-19 psychological challenges. I believe the unknown is what causes most of the anxiety. Thus, I have decided to look into data myself, given that I am a Business & Data Analyst. I thought you might appreciate as well some insights into the subject. Somehow able to work with data, understand it and slice it gives you a bit more control. It might be fictional, but control nevertheless. So here it goes.
What does data tell us about COVID-19 on 1st of April 2020?
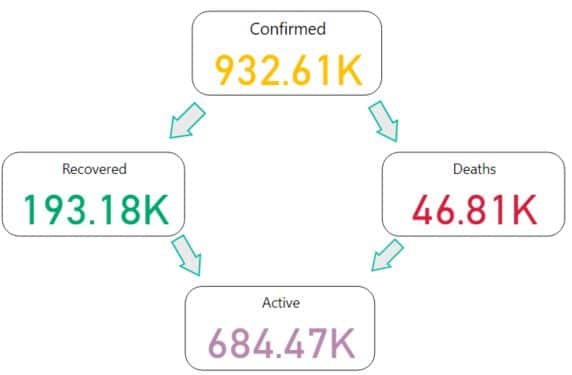
The numbers are quite unbelievable, but we should start believing them. At the moment, the world has faced 963 thousand cases of COVID-19 and 684 thousand are still in trouble (highlighted as active in data). The numbers are ever-increasing. The illustration below shows a total number of cases interlinks with two possible outcomes to give active cases.
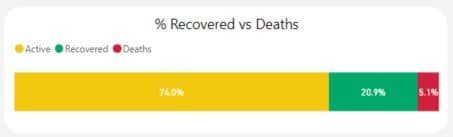
I think one of the biggest surprises to all was the rate at which the virus was spreading and the tremendous resilient it demonstrates. Even MERS or SARS cannot compete. Of course, COVID-19 has a much lower mortality rate than the two, which currently stands at ~5%. Yet it is still higher than seasonal flu, which is sitting well below 0.1%.
Thus, the combination of all three factors namely spread, resilience and moderate mortality rate that results in an extremely high number of infections and a large number of affected countries. The US, Italy, Spain China and Germany among those that are heavily struck with more than 60% of the world’s case recorded.
From the 24th of February is when things started to ramp up. Numerous additional countries/regions started to report first time cases and it was growing exponentially. Globalisation does have its pros and cons… Ultimately, resulting in the novel coronavirus being classified as a pandemic on 11th of March 2020 by the World Health Organization.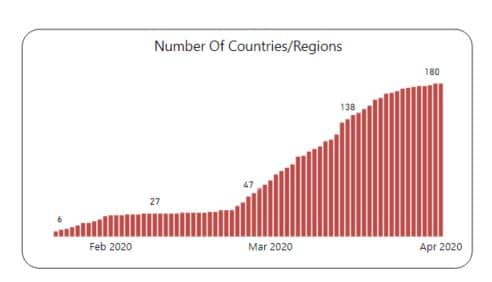
Still, not all is gloom and doom, 21% of individuals managed to recover now as seen in the bar chart above. A large portion of these is in China and positive results are seen in South Korea.
Quality of data:
There are multiple factors affecting data in such extreme conditions. Starting from how many tests are performed. If they do more like in Germany then the overall recovery rate will be higher. If we test only those that end up in the hospital it will be much lower.
Also, it matters what doctors put on the death certificate as to the cause of death. Multiple patients have underlining health problems before succumbing to COVID-19 and doctors may decide that previously existed condition or complication resulting from coronavirus is the one to blame. Thus, decreasing overall cases from the novel virus.
Some initial results from China indicated that the ageing population is also a factor. But new cases in the US, UK and the rest of the EU giving some different results. The medical community is no longer so sure.
Finally, we may just not be able to capture all the data every day as things are moving extraordinarily fast. We are talking about the pandemic in the world after all!
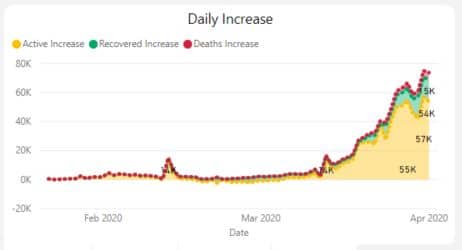
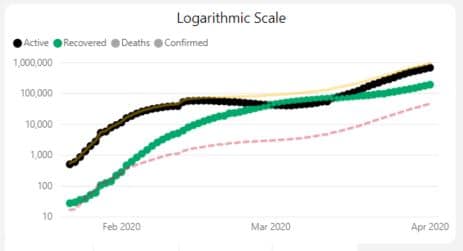
Daily Increase:
Although, the logarithmic scale shows that the growth rate of new and active cases are decreasing. But even last night, 75 thousand new once have been added to the total (please, have a look into the dashboard for more up to date numbers). There was a short point of relief during the first two weeks of March when the growth rate of active cases has been decreasing at an increasing rate. The increasing growth rate of recoveries and lower growth rate of the new case provided the relief. However, this was short-lived.
Hopefully though, warmer, sunnier weather and increased accountability of society will suppress growing numbers. Thus, providing so needed support to your countries health sector.
Conclusion:

This is no time to relax. Please, do follow the guidelines of governments. Stay at home, wash hands for 20+ seconds and avoid all unnecessary contact. Let’s be more responsible. If not for other’s sake at least for your own. Literally, all of us can suppress new cases growth rate. It is in your power to alter growth gages. And hopefully soon, we can all start seeing a growth rate of recovered cases higher than new once. Also, do not be discouraged if changes you make are not yet reflected in overall numbers. It takes time to change the world. But as they say, if you want to change the world you should start with yourself.
You can track all the insights I have discussed so far in the dashboard below. I will update it daily.
Appendix:
- NHS Guidelines: Link
- Raw Data source: The Center for Systems Science and Engineering (CSSE) at JHU
Dealing With COVID-19:
Subscribe to our newsletter!
Latest Blog Posts
- Navigating Project Management in a Matrix Organization: Challenges and Solutions
- Using Artificial Intelligence’s Power in Agile Project Management
- Sustainable Project Management: Trends, Tools, & Strategies
- Unlocking Strategic Value: How NIST CSF 2.0 Shapes Project Choices for Better Outcomes
- Cybersecurity Project Management: Protecting Your Digital Frontier
- What are the Different Types of Planning in Project Management?