How Long Does it Take to Become a Data Analyst?
Plus, 6 Useful Data Analyst Skills What Do You Need To Know?
If you are reading this blog post, you must what to become a data analyst or enhance your data-crunching abilities. But you do not know how long it does take to become a data analyst. Well, you are in the right place! I will go through all the essential abilities that make a data analyst and indicate how long it takes to learn each skill. Trust me; you do not need to be born as a data analyst, spend years learning a skill or paying thousands of dollars/pounds/euros. Learn these six skills in under 1 year using an online training platform, and you will be well on your way.
Time It Takes to Become A Data Analyst
| Nr | Data Analyst Skills | Estimated Time Required |
|---|---|---|
| 1. | SQL | 1 month |
| 2. | Microsoft Excel | 1 month |
| 3. | R or Python | 2-3 months |
| 4. | Data Visualisation | 2-3 months |
| 5. | Critical Thinking | All your life, but could do 1 months course |
| 6. | Presentation Skills | 1-2 months |
| 7. | Not machine learning | Not a must for Data Analyst |
| Total | 8-11 months |
So, it would take you from eight to eleven months, less than a year, to become a data analyst. The next thing after that would be to get experience. One way you can gain experience is via a normal job application route. Another way is by actively working with your current employer to gain more data analyst tasks. All business would benefit from a data analyst.
Also, having a degree in maths, science, economics or similar may allow you to convince your future employer that you have the right background. Otherwise, you will need to create a portfolio of examples to show what you can do with your existing or newly gain data analyst skills. But first thing first, let’s learn what a data analyst is.
As for machine learning, you do not need it to become a data analyst, but it is the next step to make thing challenging enough. In most cases, the time required is from six to twelve months to start with.
Who is Data Analyst?
Data analysts analyse multiple data sets, map them together to identify trends, validate if any given project can use them. He/she will create graphs and even dashboards, allowing businesses to make data-driven decisions. The objective is often defined, and data analysts are looking for a solution or additional issues linked with the objective.
There are multiple roles that a data analyst can assume. Depending on the industry, the analyst may work on external market research or internal client behaviour, to name a few.
The ultimate goal is to source data, clean, transform it and present it back to business in a beautiful format, including a report, dashboard and presentations. These will suggest impactful solutions to the problems or introduce brand new opportunities.
Let’s dive into 6 Required Skills to Become A Data Analyst.

1. SQL: Key Data Analyst Skill
SQL or Structured Query Language used in most structured databases. But what does it mean, structured? These are databases that store financial transactions, client lists, products data. In other words, standard business data. Therefore, if you want to access data and complete your analysis, you just have to learn SQL.
SQL looks very fancy on a phase of it: a lot of letters, code and rows. But in reality, it is straightforward. It has an apparent structure, which is easy to learn. The best thing is that you then can apply that structure in all structured databases.
- You will specify where to look in the database.
- Specify if you need calculation or specific columns
- Tell me how to filter data.
- If you need to group at the end
- After grouping, you can add additional logic as well.
Somebody, who knows SQL, will say that there is more. Sure, there is, but to start with, this will do.
The great thing with SQL is that it can handle massive amounts of data. Thus, when you do your analysis, do as much as you can with SQL. Then combine what you get from SQL query with other tools, which we will discuss in a second. Resulting in you getting all the insights you need.
Word of caution: SQL does not allow quick filtering, present data in graphs and does the more complex calculations. Thus, I usually only use SQL at the beginning of my analysis.

2. Microsoft Excel: Key Data Analyst Skill
You likely know Excel to some extend already. If not, no worries! There are a lot of resources available online to pick up basics and more. Following things you should be good in excel (not an exhaustive list):
- If statement
- Pivot tables
- Vlookups
- Index & Match
- SumIfs
When I have run the SQL query, I have got a set of data, which I may have grouped, filled or joined a few data tables. In essence, prepare data for other stages. Then I may jump in Excel to do quick filtering, pivoting, initial logic to start getting some initial insights about data. If necessary, create some initial graphs. I may jump back and forth from SQL to Excel until I am happy with the final data set.
There are few issues in Excel that requires you using other tools as well.
- Excel cannot handle large data sets.
- If you have a lot of calculation, Vlookup, etc., in a spreadsheet, it will run slow.
- If you do Vlookup, where could be two or more matches, Excel will only pick up the first match.
- When you do filtering on multiple criteria, it gets manual.
Thus, we need to use Excel in combination with other tools like SQL or Python.

3. R or Python: Key Data Analyst Skill
Things get a bit more advance from here. When people say you need to learn R or Python, you think that you will need to become a programmer. Sure, you will need to learn to code. But to a lesser degree than what you need to know when building apps.
The goal here is to pick up libraries (i.e. extensions) to help you with data analysis and automation. There are a lot of great courses online. Plus, I have created the Python Data Analysis Beginner Guide. It should help you to save time and money by only learning what is essential in the beginning. You can check it out here: python course.
Say you have got your SQL data ready and did some Excel investigation on a smaller set. But the live data set is much larger. Your goal is to transform, clean data in a fast and automated way, maybe do some pivots. SQL data set is just too large for Excel to work.
Well, R and Python are just perfect for that. For many reasons. The preview of my course explains a lot about them. After you learn, these tools you will be able to build a simple programme in one-day that prepares your data for the next step, Visualisation. The tools you create are highly reusable, and you can even expand functionality later on as well.
The drawback is that Python and R do become more technical and less user friendly. But I guess this is where professional data analysis comes in. Those who know these tools can solve multiple data problems with great flexibility.
Btw, Python and R do have visualisation capabilities. Though it takes time to set each graph with code and created dashboard are less appealing. If you just need one or two graphs on extensive data set, then it is perfect. But, if you are after dashboards, it would be much easier to use our next tool.

4. Data Visualisation: Key Data Analyst Skill
My choice for data visualisation tool is Power BI. One reason it is very similar to other Microsoft Office tools. So, the learning curve is much more comfortable. You can get it for free with a business email for one user, which gives you almost full access to the complete set of features. Thus, you can quickly start learning. Some other great tools are Qlik Sense and Tableau.
Business and individuals use data visualisation tools because they can combine various data sets, do cleaning, transformations and calculations (for more advanced users) and then use integrated visual tools to create amazing interactive graphs. Finally, it usually has excellent share capabilities to distribute information to the broader audience.
It is a powerful tool for data analyst because people like visuals; you can quickly answer raised questions on the spot in the scope of data sets. Therefore, one dashboard can then have countless ideas, insights for the company to explore and generate value.
Continuing with our example: You have created a data set with SQL; did some initial exploring with Excel; automated cleaning and transformation steps with Python; time to create a dashboard. Power BI has multiple ways to take in data. When it is in the tool, you use it to pick and drop graphs and select the column you want to use. When done with filter tools, you can lock it down and give it for business to use.
To be fair, Power BI can take data straight from SQL databases and complete cleaning and transformation. Thus, ultimately, what tool to use or when boils down to where the data is, what you are trying to achieve, what is just easier.

5. Critical Thinking: Key Data Analyst Skill
There has been a lot said about this skill online. I will give just a straightforward explanation. If you want to be a data analyst, you need to think for yourself, see patterns; understand how data needs to link, what you are trying to achieve, and the business goal?
Some people may find it easier to find patterns and logical clues in the data; it may be more challenging for some. But I found asking a simple question, “WHY?” multiple times goes a long way. At each stage of phrasing and asking the question, you get closer to the reason you see data as it is. Then you can make some conclusions and assumptions, which you can go and test.
Critical thinking is one of those Data Analyst Skills that can be used regardless of what you do or what tools you use. So, please, do not neglect it.

6. Presentation Skills: Key Data Analyst Skill
When you have completed your full analysis, you will need to find a way to present it. The fact is that most people do not see an excel spreadsheet that appealing. They want key-points, insights, interactive graphs, info graphs, all digested to consume.
So, your job is to take all that knowledge you have got from understanding data and show it so that it is super clear and easy to digest. It doesn’t matter how great your analysis is if nobody wants to have a look. Thus, make sure that outcome is so simple that they do. I think it is tough. As Mark Twain said: “I didn’t have time to write a short letter, so I wrote a long one instead.” It applies to data presentation as well!
Power BI lends itself quite easily to present data concisely. But the combination of PDF report, PowerPoint presentation, and clean Excel Tabs may also be used to highlight the main point of the analysis.
PowerPoint: Bonus Data Analyst Skill
Yep, you do need to know how to use PowerPoint. You need to communicate your ideas. PowerPoint has some handy tools like screen recording. Why not include a record if it explains the point better and gives required insights?

Why Do You Not Need Machine Learning To Become Data Analyst?
In my previous post, I explain the differences between the data analyst and data scientist. Machine learning is a tremendous but complex tool. The fact is there is just way too much-structured data that business still needs to utilise before venturing to big unstructured data. For 95% of the company, the benefits do not outweigh the costs.
To do machine learning professionally, you may need to start thinking about a degree in statistics, sophisticated forecasting, and other scientific computing. That is not to say; you cannot learn it online. However, companies often require somebody with a masters or PhD in statistics before considering them for a position.

Final Example: Using All 6 Data Analyst Skills
Let’s have a look at the fictional data analysis example. Say your existing AirBnB business want to expand to New York. You want to do some market research and see what you can charge based on the neighbourhood and room types.
Also, let’s assume that we already have data from AirBnB loaded into our business’s database. Thus, we can use SQL to extract data for 2019 and do some analysis.
We will use Data Analyst Skills and SQL, Excel, Python and Power BI tools to show grouped data, pivot table and graphs, where possible. I will replicate a similar result in each tool. The idea is that you can use either tool to get the result you want or even a combination, as discussed in the post. It all depends on how much data you have and where it is stored. You then use the tool that is the strongest in the feature you need.
1. SQL Data Analysis Results
Our database table name, where data is stored, will be named AB_NYC_2019. If you are wondering how to run SQL code on your computer, check out my latest blog.
We would have to create a little SQL code to extract our data and group it by the columns we need. Also, ask the system to give us Avg price.
SELECT
	neighbourhood_group
	,room_type
	,AVG(price) AS "Avg Price"
FROM AB_NYC_2019
GROUP BY
	neighbourhood_group
	,room_type
ORDER BY neighbourhood_group, room_type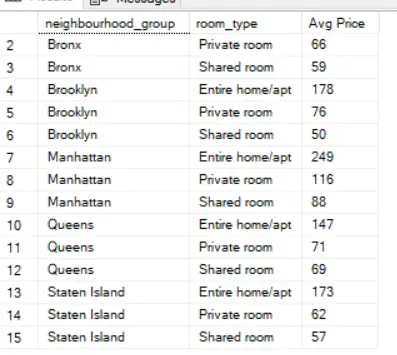
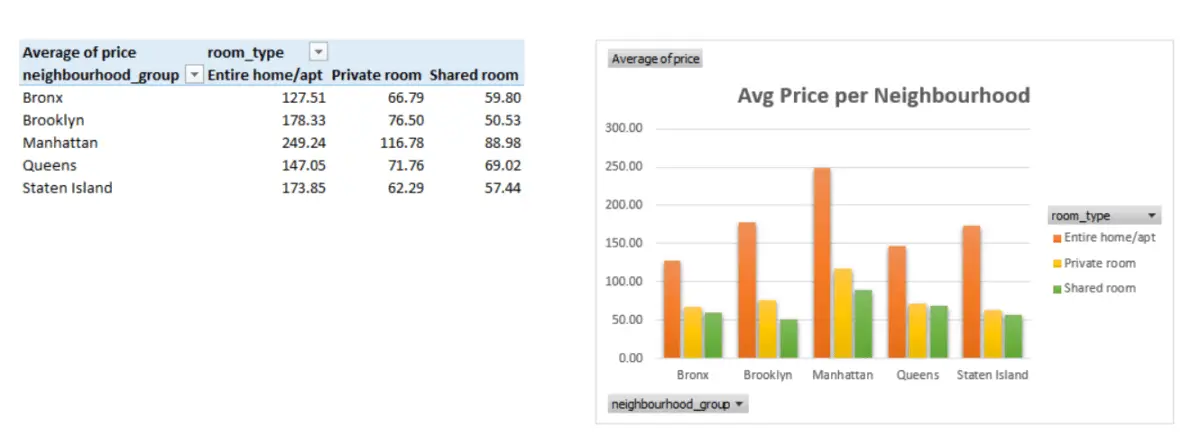
2. Excel Data Analysis Results
If you use Excel, you will have to create a pivot table. In my version, I use room type as columns. So, it is easier to see the data. As Excel allows graphs, I will provide a chart as well.
3. Python Data Analysis Results
Let’s look at how this would look like in Python. Keep in mind, that for such simple example, Python might be overkill. Except if you are feeling confident. However, we can compare how we can get the same result.
import pandas as pd
%matplotlib inline
import os
import numpy as np
import matplotlib.pyplot as plt

file_AB = os.path.expanduser(r'~file location')

dfab = pd.read_excel(file_AB, sheet_name = 'AB_NYC_2019')

dfab.head(2)

ptab = pd.pivot_table(dfab
                ,values='price'
                ,index= ['neighbourhood_group','room_type']
                ,aggfunc= np.mean)

ptab.unstack()

ptab.unstack().plot(kind='bar')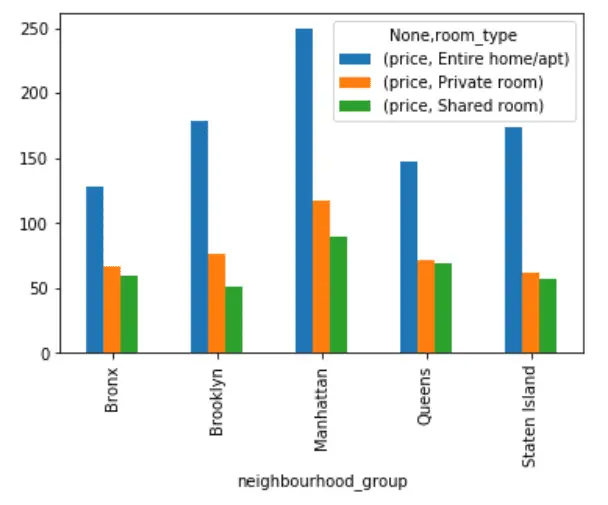
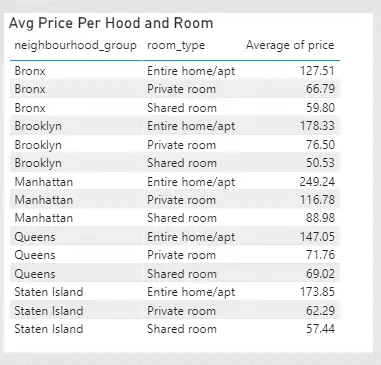
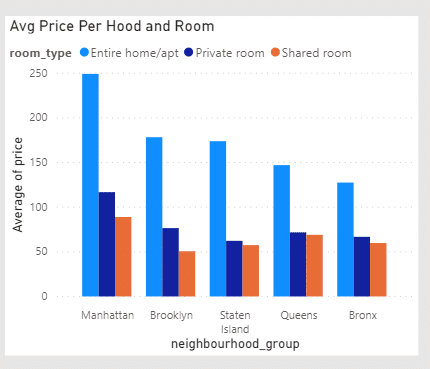
4. Power BI Data Analysis Results
Finally, I will use Power BI to get the same result. Again, Power BI for this task might be a bit too much. But if you have more data feed, different relationships, you want to explore or need interactive views. Power BI is by far the best.
Do you agree with these 6 essential Data Analyst skills and time it takes to become a data analyst? Which one will you start first? Do you think there should be more critical considerations? Comment down below.
Subscribe to our newsletter!
 ABOUT ME
I am an experienced ex. Business & Data Analyst and now a Project Manager with multiple years of experience gained in several international companies.
These days, business problems require data crunching and telling stories to make the right decisions. Simply put, business stakeholders need insights into their projects and deliveries.
This is where I come in. I have learned and applied Python, Power BI, SQL and Excel to analyse and present data. Also, I gained experience in Project Management and Business Analysis. So, I can not only spot insights but execute business decisions. Moreover, I can teach you as well. Read More
Best Books


Latest Blog Posts
- Sustainable Project Management: Trends, Tools, & Strategies
- Unlocking Strategic Value: How NIST CSF 2.0 Shapes Project Choices for Better Outcomes
- Cybersecurity Project Management: Protecting Your Digital Frontier
- What are the Different Types of Planning in Project Management?

- Transforming Project Management with AI Software: Tools, Challenges, and Best Practices
- Unlocking the Benefits of AI-Powered Project Management
Need Project Manager’s Help!?
Check out the Fiverr marketplace if you do not have time to run your own projects or just need extra help. They do have multiple project professionals, including project managers. Maybe you will find just the right fit to take some burden from you. I have used Fiverr in the past. The prices are also not too bad. If you seek PM via the corporate route, it will be easily 5x the price.
